 717 798 3495


Optimizing your E-commerce web site is no small feat. So you better start in the right place. Too often we run into E-commerce teams that have fallen into the habit of “shotgun AB-testing”, they spray AB-test all over the place with no clear idea of how to prioritize their testing. Our E-commerce Effectiveness analysis will help you find where your E-Commerce site is hurting the most, so you can fix it as soon as possible.
(At the end of this post you will find a link to a Google Sheet that will help you do your own analysis). 
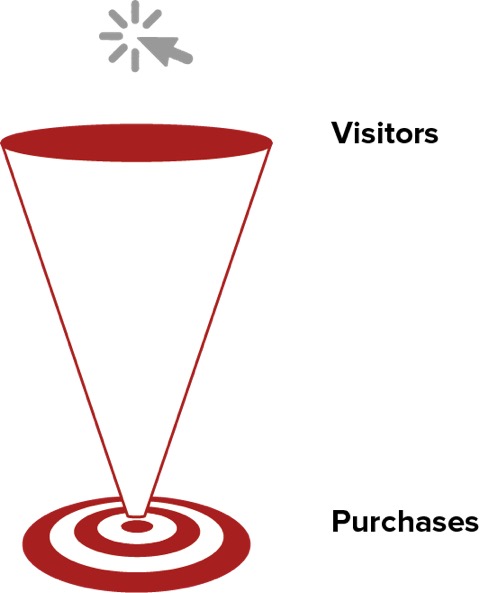
Too many web analysts do what we call “black box analytics”. They treat the web site like a black box that converts
visitors from different traffic sources at some rate. Visitors arrive, some of them convert, what happens in between is some magic black box, which sometimes work and sometimes don’t.
These web analysts spend most of their time in the acquisition tab in Google Analytics, with occasional dips into the Conversion tab. So their E-commerce funnel looks like this: Visitors vs Conversion goals.
 I was inspired to write this post as I read a post published just a few weeks ago on this blog: “7 Key Performance Indicators for eCommerce You Should Be Tracking”. I think the post was inspiring and gave a nice overview. But I wanted to show you the different micro conversion steps that drive visitors forward on an E-commerce site.
Behavior first – KPIs second.
In order to set the correct KPIs and metrics that you want to monitor, you first need to understand the visitors actions and behavior – that you want to boost. When knowing that, you should define metrics that reflects the wanted behavior as closely as possible.
If you do it the other way around, there’s a good chance you will arrive at metrics that are – “Things we are able to measure. Now let’s try to figure out what they mean”.
The combined effectiveness rate of the individual conversion steps will determine your total conversion rate. By tracking each individual step you will be able to find out where things go wrong and focus your optimization efforts on this particular step.
That’s theory. Now let’s look at it in practice by going through the 5 conversion steps of an E-commerce site.
E-commerce conversion in 5 steps
The 5 basic E-commerce conversions steps are shown in the image. They reflect the micro actions that you want the visitor to perform on your site.
You might notice that I’m not using Google Analytics Lingo at this stage. Right! That’s because I’m not talking about what GA can measure. I’m talking about what behavior I want to drive.
Step 1 – Make them stay
The first step is trivial. You want visitors to stay – Not bounce. The key to engagement is Relevance, Value and Trust. If the visitors feel like they came to the right place (Relevance), and they quickly can see What’s In It For Me (Value), and they feel they can trust you – they will stay.
Metric: Engagement rate
Step 2 – Find products
If you compare this to a physical store, you need to take the shopper to the right aisle and display in the store, so that they have the physical ability to actually put the item they came for in the cart. For most E-commerce sites this means taking the customer to the correct product page. But you need to be a bit careful, since on some sites the majority of ”add-to-carts” happens on category pages, in search results or perhaps directly in the search box!
If you have a problem at this stage you have a “Findability” problem. You need to improve navigation and site search. Or you might not be driving your paid traffic to the right landing pages.
Metric: Finding rate
Step 3 – Add to cart
Adding something to the cart does not automatically mean the visitor will buy it, but it’s an important step on their way to the purchase.
You increase your add-to-cart rate through the persuasive design of your product page – both in terms of layout and content. (Once again – If add-to-cart happens on another page than the actual product page, you need to take this into consideration).
Metric: Product Page Effectiveness rate
Step 4 – Start checkout
If your visitors cart is full of products, you now want to take them to the checkout as quickly and smoothly as possible.
This might seem like a no-brainer, but I often have to look quite hard to find the place to start the checkout. And just because you are actually able to find it, doesn’t mean you are motivated or persuaded to do so. Ask yourself: – “Where and how can I start pushing my visitors towards the exit in a gentle but firm way?”
Metric: Checkout Start rate
Step 5 – Complete purchase
This is the final conversion goal – The purchase, the receipt page. Cash registers spin. Everyone is happy.
Metric: Checkout Completion rate
Hey – Waddabout Cart abandonment rate?
Cart abandonment rate is something that many people pay a lot of attention to. They’re right! And wrong. Knowing how many visitors choose to leave their cart instead of completing the purchase is of course important. The only problem is that the metric is a combined metric of two behaviors, starting the checkout and completing the checkout. In your case you could suck at one of them and excel on the other. Then, you would see a cart abandonment rate at ”industry average” and you would not know what to fix. Therefore you need to break this metric down into step 4 and 5.
The E-commerce Effectiveness model
Now let’s tie these behaviors to their equivalent metrics.
We’ve chosen to create a “tool agnostic” taxonomy so that you’ll be able to create these metrics regardless of what analytics tool you are using. We call it the “E-commerce Effectiveness model”.
Google Analytics has recently added “Enhanced E-commerce Analytics” to their tool. In particular the “Shopping Behavior Analysis “ is quite close to our model.
The major difference is that we’ve chosen to put metrics that show transitions between individual steps in focus, whereas Google has chosen to focus on the combined ratio of visitors that make it to that point. We believe that breaking out individual metrics tied to progression from one point to the next serves you better in terms of understanding WHERE you should put your optimization focus. It also means you can start to get grip on some of your steps, even if you haven’t implemented Enhanced E-commerce yet.
Conversion Conference has evolved into Digital Growth Unleashed!
Create the most compelling end-to-end customer experiences. Attract, persuade, serve, and the technology to make it happen – we’ve got you covered with four parallel breakout tracks! Plan early and get the absolute lowest rates possible for May 16-17, 2018 at the Mandalay Bay Casino & Resort, Las Vegas.
You can read more about Google Enhanced E-commerce Analytics here
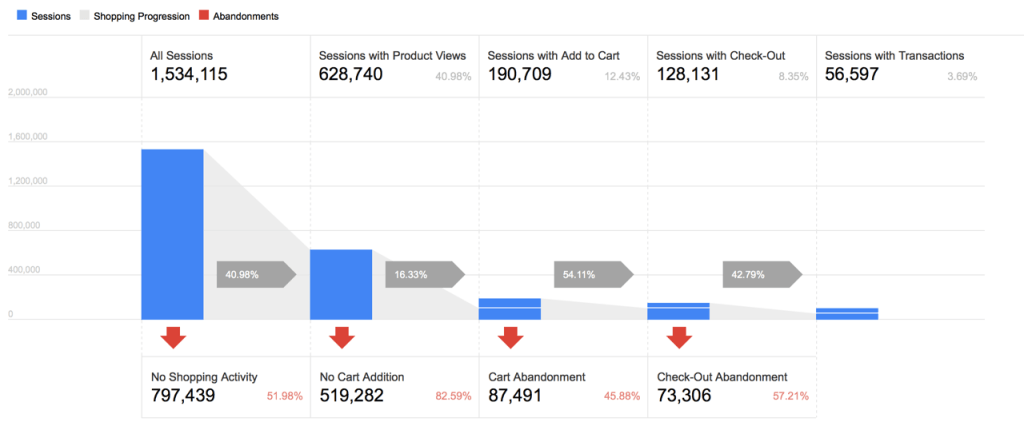 An example of Google Analytics Shopping Behavior Analysis report
| Behavior | E-Commerce Effectiveness Metric | GA Metric |
| 1. Make them stay | Engagement rate | 100% – Bounce rate |
| 2. Find products | Finding rate | Users with product view (or product click) divided with Non Bounce Users |
| 3. Add to cart | Product Page Effectiveness rate | Users with “add to cart” Divided with Users with product view (or product click) |
| 4. Start checkout | Checkout Start rate | Users who visited checkout start page divided with Users with “add to cart” |
| 5. Complete purchase | Checkout Completion rate | Users who completed the purchase divided with Users who visited checkout start page |
How do I know how I’m doing?
The final step of this model is of course looking at benchmarks and industry averages, so that you can get an idea of how you are doing.
And the answer is: To get a little you need to give a little.
We’ve made a Google Sheet tool where you can fill in your own metrics in order to start analyzing your E-commerce site in this way. You can access it here: E-commerce Effectiveness Tool.
From time to time I ask users of this tool to share their E-commerce Effectiveness rates with us, and by looking at the data I can help all participants get a better understanding of where they stand. Sharing is caring. This is not mandatory, just a kind request.
The results I have so far are below. Please note that it’s based on a small sample in the Scandinavian market, so you might find it different from your own numbers
| E-Commerce Effectiveness Metric | |
| Engagement rate | 40% |
| Finding rate | 70% |
| Product Page Effectiveness rate | 25% |
| Checkout Start rate | 70% |
| Checkout Completion rate | 45% |
As you can see the hardest step is to get shoppers to put an item in the cart. Second hardest is to convince them not to bounce. I think this is well in line with E-commerce AB testing results in general. Product pages tests have a big potential, as well as site-wide elements, which increase relevancy, value and trust for all landing pages.
How do find out what to test and how does you E-commerce Effectiveness stack up? Please leave your comment below.
About the Author
 John Ekman is the founder of Conversionista, a small but highly regarded Conversion Optimization Consultancy. John is the guy who saw Tim Ash at a conference in London back in 2008 and promised himself to become “The Tim Ash of Sweden”. When Tim first heard this he said: “There can only be one me”. After getting to know John better he later admitted John to the franchise of being Sweden’s own Tim Ash.

John, great post as always. An excellent and fresh look at analyzing the performance of an ecommerce site. Question: do you feel it is more relevant in making those measurements to use unique visitors, or total sessions? Generally, I go with total sessions without regard to how often one visitor has more than one session, and for things like Bounce Rate, it’s difficult to do otherwise. So I’m assuming you go with that throughout. But your descriptions (“Users with…,”, “Users who…”) sound more like unique visitor type metrics. What do you think there?